
Global Procurement Areas of Reportable Productivity
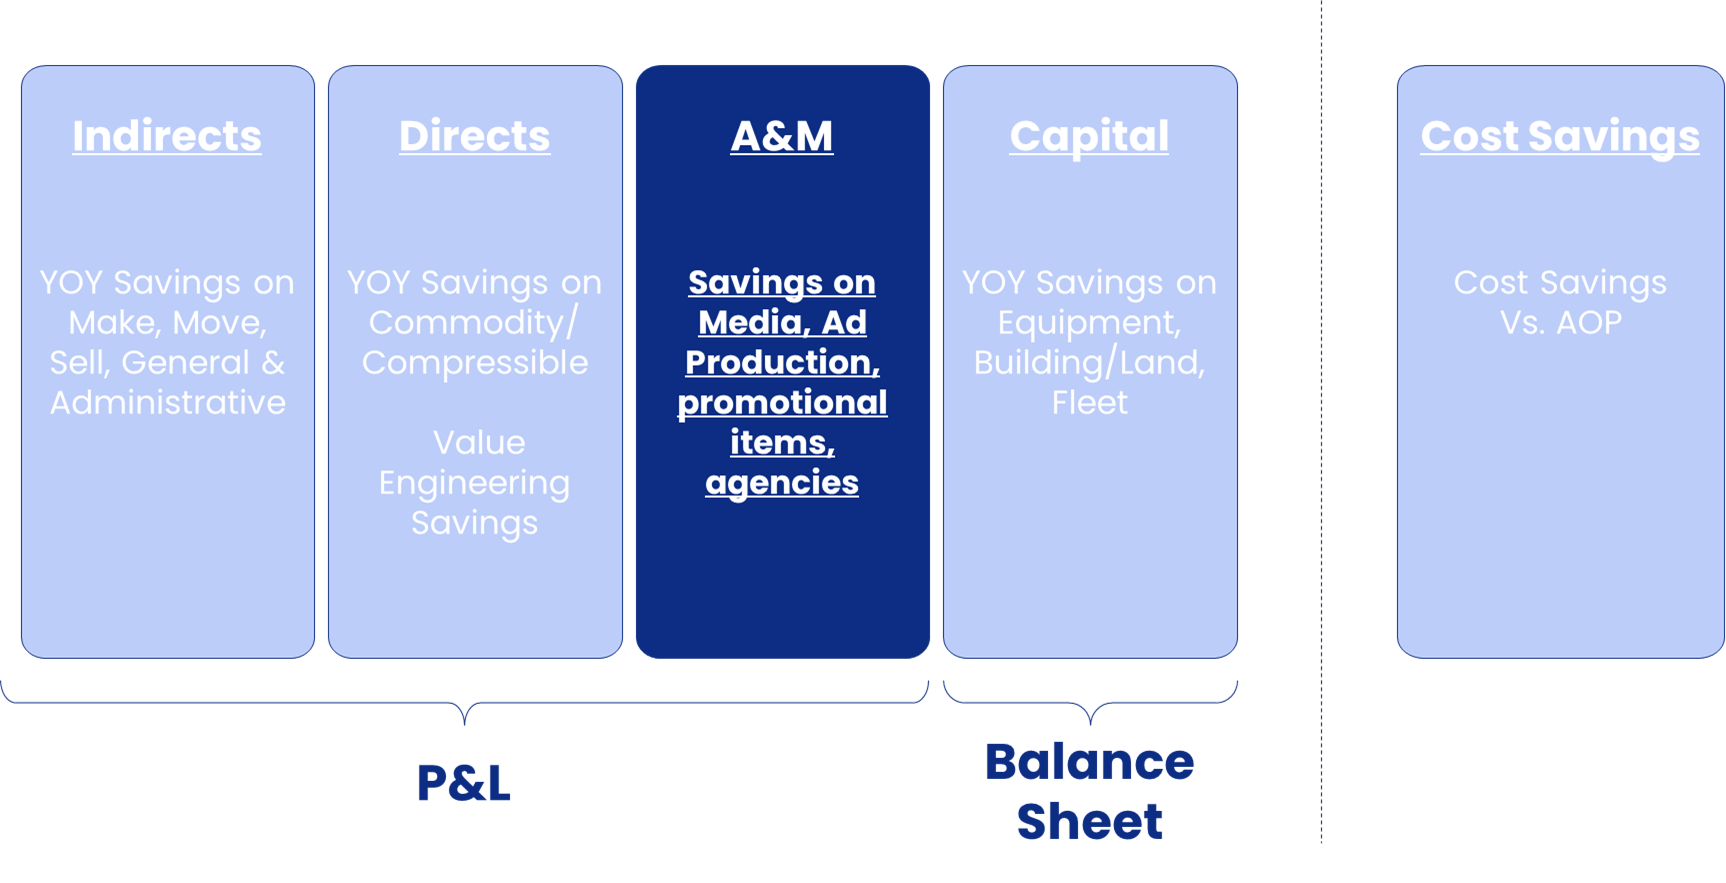
Major Types of Expenses within A&M
A&M Productivity Definition

Productivity = (YoY change in cost per unit) x (Number of units purchased in the current year)
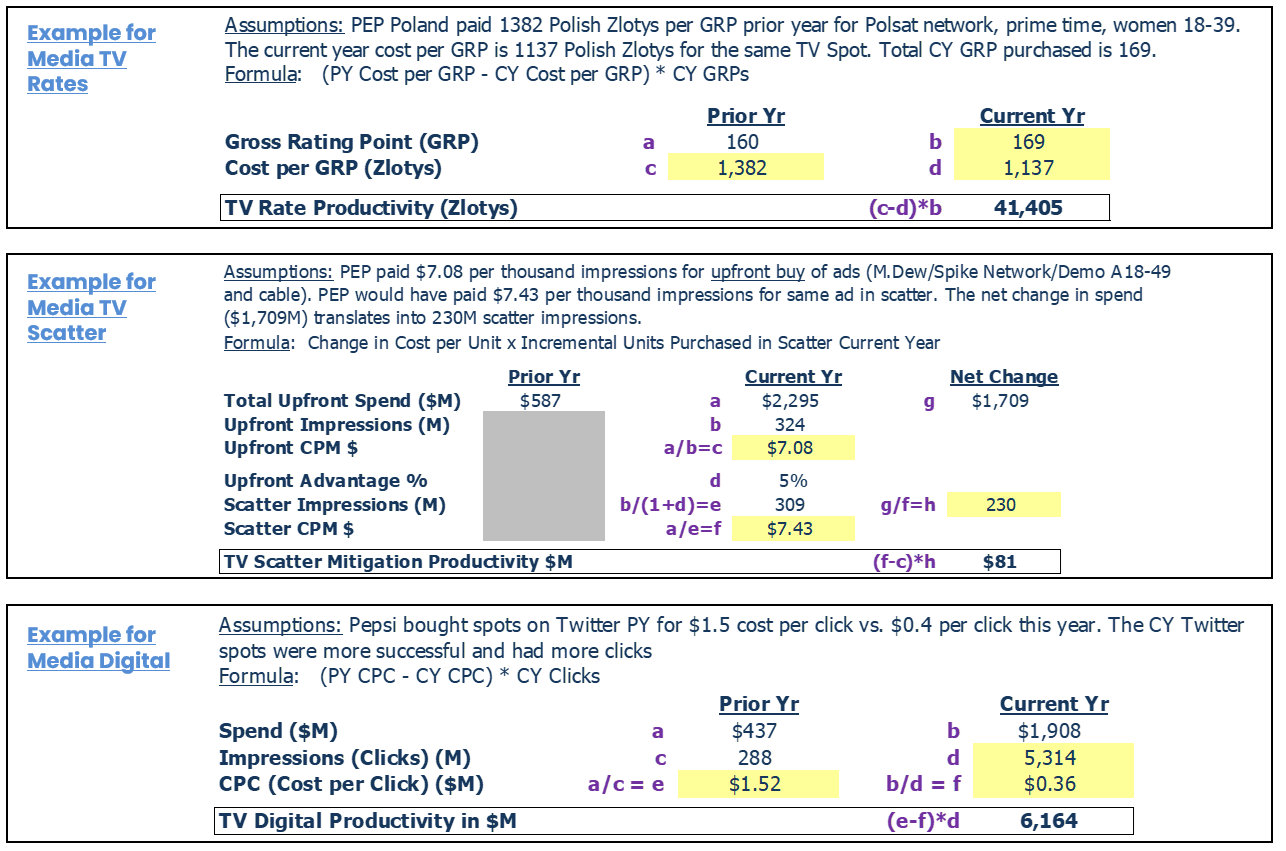
Media Placement Example - TV Rates/Scatter/Digital
Working A&M

Example: Procurement Team and Media Agencies activities to drive value:
- For TV rates, Global Media / GP Team consolidates media budgets per market per channel and partner with OMD/Mindshare to negotiate rates and other qualitative KPIs.
- Leverage PO1 to ensure advantaged rates are negotiated and received through Media Partners (Scale of PEP scale of OMD). For scatter, consolidate budgets to secure premium inventory and scale of investment.
- Provide analysis for stakeholders on estimated savings vs. scatter to drive efficiencies.
- Drive the US Upfront process with OMD and review PY to ensure OMD delivers competitively.
- Analyze global spend, conception of strategic levers, conduct sell-in to stakeholders. Design framework for negotiations to yield YoY savings.
- Lead Ebiquity in quantitative and qualitative benchmark auditing.
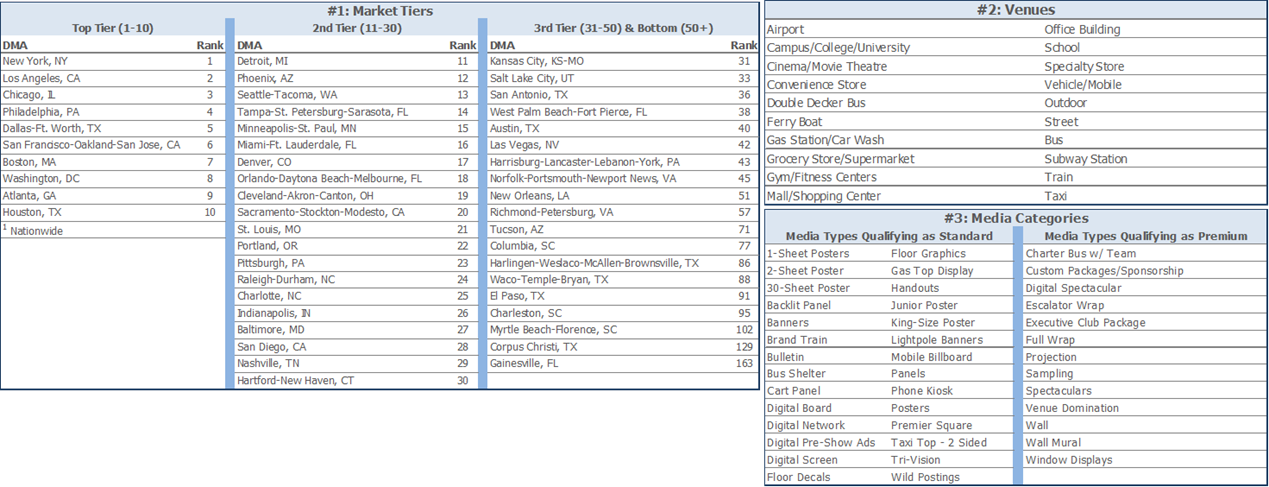
Media Placement Example - Out of Home (OOH)

Productivity calculation depending on data source (Traffic Audit Bureau validated impressions vs. supplier unit cost):
a) (PY CPM - CY CPM) * (CY impressions / 1,000) = YoY Productivity
- Source of impressions must be received from: Traffic Audit Bureau (TAB).
- Spend must be the same: Market Tier, Venue, Media Category (Standard or Premium)
Note: brand and Daypart are not factors as we are not targeting a specific viewing audience like TV.
b) (YoY change in cost per unit) * (number of units purchased in the CY)
- Same item and location (i.e. same billboard compared vs prior year rate)
Example: Procurement team/COE negotiated through OMD to optimize the cost of media types depending on marketers campaign targets:
- PY baseline contains campaigns weighted by markets (CHI, NYC, DC, PHL) and brands (Tropicana, Starbucks)
- 20 campaigns excluded from baseline such as NYC Super Bowl Touchdown Package and DC customized pop-stores
- CY contains campaigns weighted by brands (Tropicana, Pepsi) with only one market
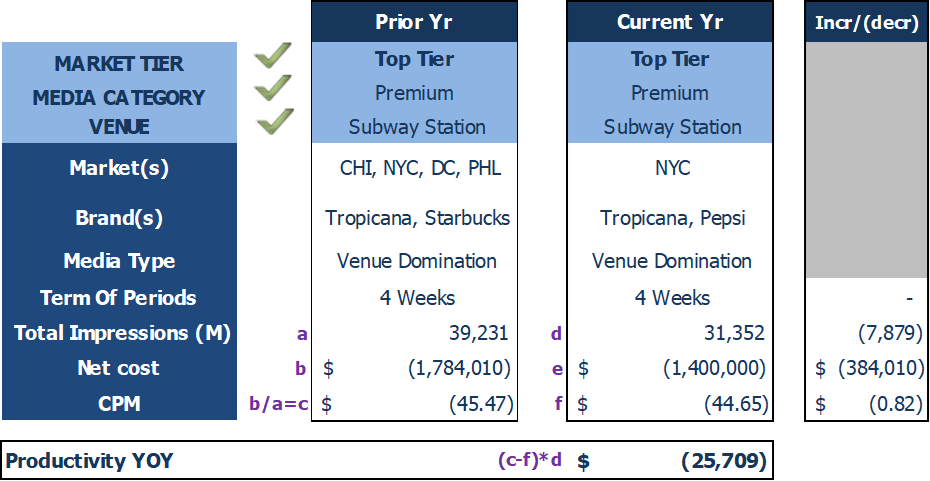
Note: GP Finance and Procurement team ensure all comparisons have similar baselines with concrete GP actions identified
- Unique OOH campaigns are tagged and not used in YoY comparisons
- Impressions source data from TAB (Traffic Audit Bureau)
In-Store & POS Execution Example

Example: Procurement Team/COE negotiates reductions in unit cost of temporary POS shipper item
- Temporary sub-category: pre-pack weekender (labeled PH-37 per supplier)
- Sub-category WAP reduced from $8.77 PY rate to $7.93 CY rate
- CY volume YTD is 366M units. Cost and units source: supplier report
- Under current WAP methodology, YoY productivity is $0.3MM: ($8.77 - $7.93) * 366M units
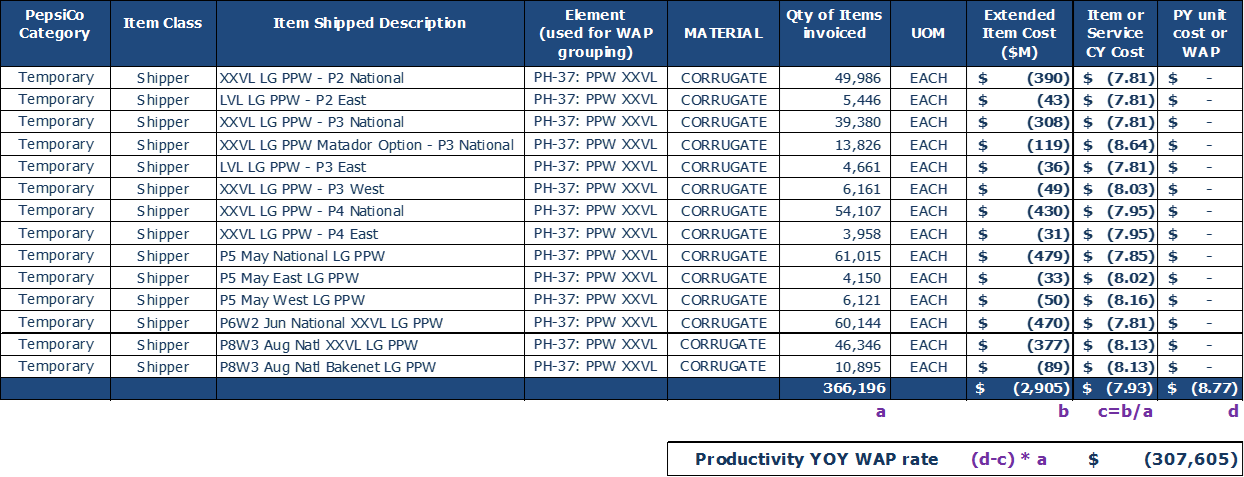
Note: 1) WAP is used when tracking YoY savings at the unit level becomes difficult due to many vendors providing similar items. Source: proof of purchase detailing volume and cost per unit (PY & CY). 2) Procurement team negotiated unit cost with suppliers which is included in WAP formula.
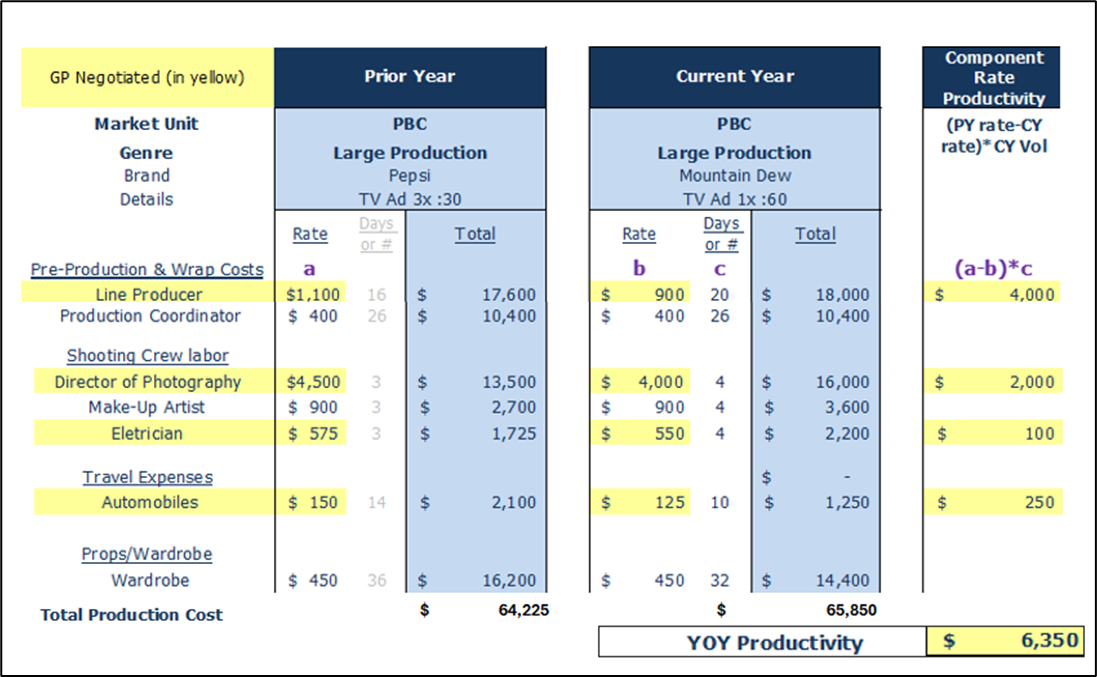
Production Example
Non-Working A&M

Example: Procurement team/COE negotiates reduction on components of production estimates
- Current Year, GP/COE only negotiated the following rates: line producer, director of photography, electrician and automobiles.
- YoY total production cost is higher due to # of days.
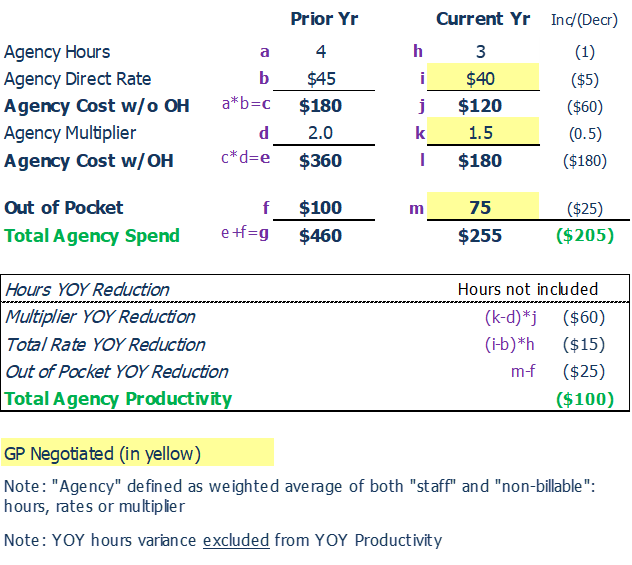
Agency Fees Example

Example: Procurement team negotiates Statement of Work (SOW) which includes multiplier, staffing rates and out-of-pocket (marketing, not COE, responsible for negotiating hours)
Example Assumptions:
- Reductions in all agency contract variables:
- 1 hour reduced vs. prior year.
- Rate per hour decreased $5 vs. prior year.
- Multiplier reduced by 0.5 vs. prior year.
- OPP for travel was reduced by $25 vs. prior year.
Agency YoY Productivity: $100MM
- $60 from multiplier reduction, and
- $15 from direct rate reduction, and
- $25 from OOP
- $105 excluded for hours reduction & multiplier mix effect - ($45) for 1 Hr $45 and ($60) for 1Hr $40 x .5
Production/Agency Fees - In-Housing Content Adaptation and Content Reutilization (Creative Solutions)
Example: In-Housing Savings
Ask: Marketing requests a new social media campaign to launch a new product.
- External prior year cost: The external agency cost for a similar scope of work in the prior year was $22,000 USD (see consideration below)
- Our Internal Cost: Our fully-loaded internal cost to produce a campaign of similar nature, including time, resources, G&A/people costs of FTEs is $5,000 USD
- Result: In-housing savings: $17,000USD
Consideration: We consider recurring work at "type of scope" level, as it is impossible to launch the same product YoY. As such, when comparing YoY savings of prior year agency work vs. in-housing, we can calculate a baseline of prior year asset production, by using an average costs of assets produced within a certain time frame and the average asset PY cost could be compared against current year in-house asset production.
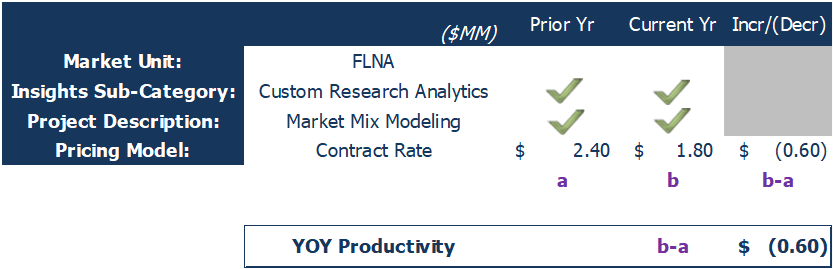
Innovation and Insights Example

Example: Procurement team negotiates reductions in unit cost of contract rate with Market Fusion Analytics after running RFP
- Sub-category and deliverable: Custom Research - Analytics and Market Mix Modeling.
- PY Contract rate was $2.4MM vs CY contract rate of $1.8MM
- Under current methodology, YoY productivity is $0.6MM: ($2.4MM - $1.8MM) * 1
A&M – Media Placements Productivity - Additional Levers
Working A&M
Note: this is an additional inform slide for specific Media Productivity levers overseen by the Global Media/GP team. For more information, please reach out to the Global Procurement Finance Team
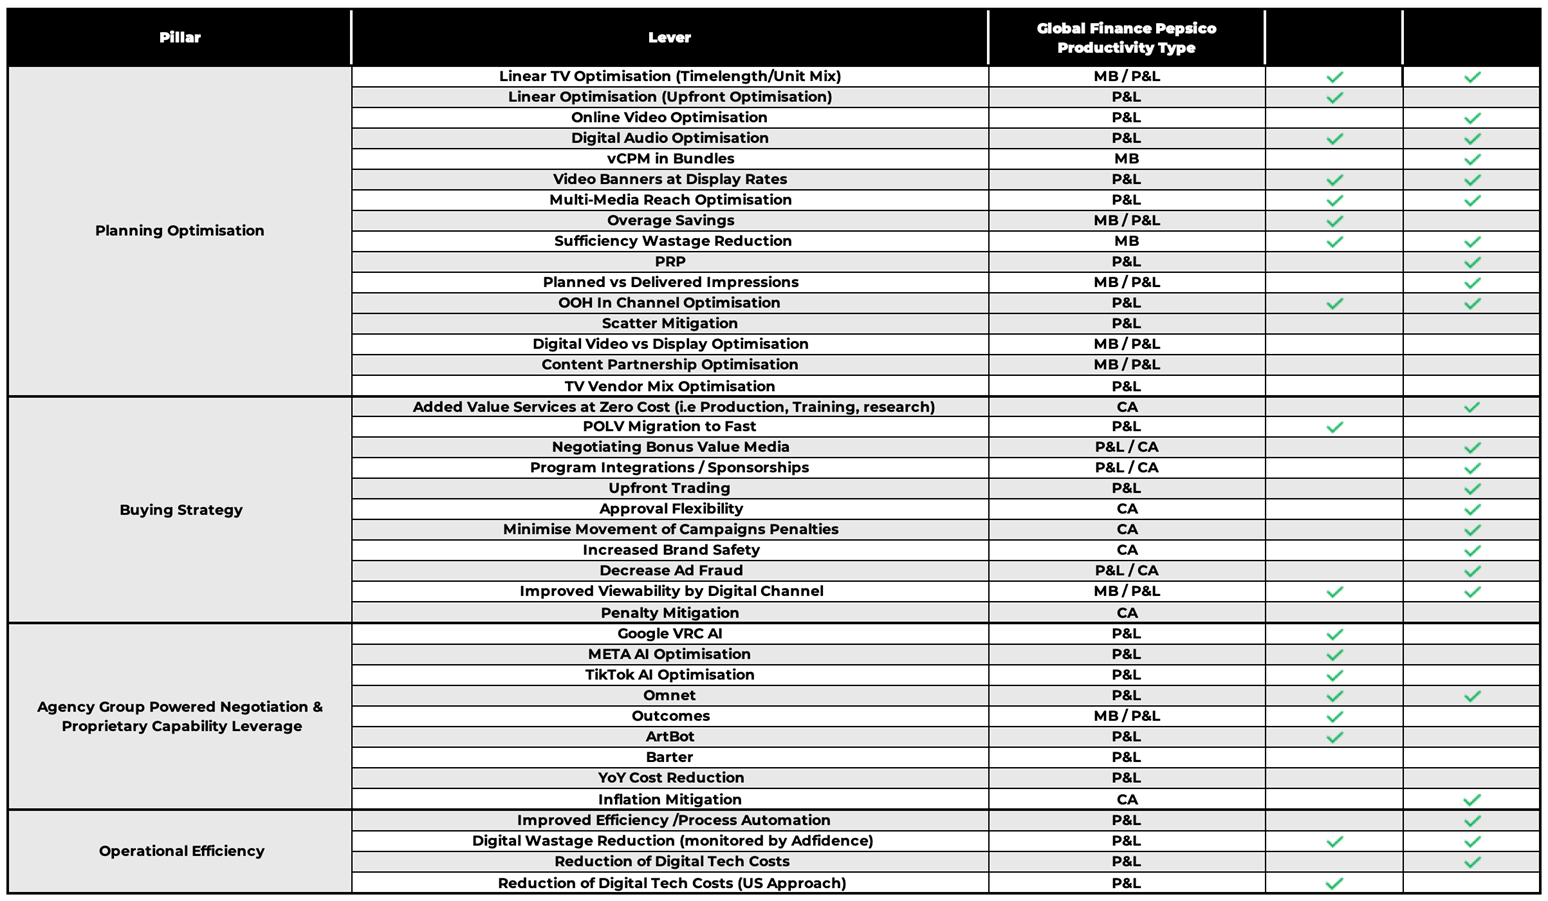
MB: Media Beliefs
P&L: Profit & Loss
CA: Cost Avoidance
MB/P&L: Must show same marketing resonances to count as P&L
P&L/CA: Lever-specific criteria must be met to count as P&L